[파이썬] 트럼프 대통령이 1년 동안 게시한 트위터 데이터 분석!!
728x90
반응형
트럼프 대통령은 트위터를 굉장히 많이 사용하는 것으로 유명하다.
여기서 많이 사용하는 단어와 해시테크 그리고 언제 트위터를 많이 사용했는지 등을 알아보고 보기 쉽게 정리해보자.
구체적으로 트럼프 대통령이 2017년 1월 20일 취임 후, 1년 동안 게시한 2,500여 개의 트위터를 분석해보자.
- 가장 많이 사용한 해시테크(#)
- 가장 많이 사용한 키워드
- 가장 많이 사용한 멘션(@)
- 월별 트위터 통계
분석 후, 데이터의 유형에 적합한 시각화 코드(막대 그래프, 단어 구름)를 작성해보자.
이전의 파이썬 데이터 분석 기초단계의 실습을 복습하고
트럼프 대통령의 트위터를 분석하고 데이터의 유형에 맞게 시각화해보자!

1. 필요한 라이브러리 import 하기
먼저 데이터분석에 필요한 라이브러리를 import 하자
# 트럼프 대통령의 트위터 모음을 불러온다
from tweets import trump_tweets

# 그래프 시각화에 필요한 라이브러리
import matplotlib.pyplot as plt

# 단어구름에 필요한 라이브러리
import numpy as np
from PIL import Image
from wordcloud import WordCloud

# 특화된 컨테이너 모듈에서 수 세기를 돕는 메서도 불러오기
from collections import Counter

# 문자열 모듈에서 특수문자 처리를 돕는 메서드 불러오기
from string import punctuation
- tweets.py
: 트위터에서 트윗을 가져오고 트윗에 관련된 작업을 수행하기 위한 기능을 제공한다.
- trump_tweets.py
: 이 파일은 트럼프 대통령의 트윗을 가져오고 관련 작업을 수행하기 위한 기능을 제공한다.
# PIL, wordcloud, collections.Counter, string.punctuation 설명
# from PIL import Image
: Pillow 라고 불리는 PIL 라이브러리는 이미지를 분석하고 처리하는데 유용한 라이브러리다.
이를 통해 아래의 작업들을 수행 할 수 있게 된다.
→ 이미지 저장 및 불러오기
→ 효과 주기(크롭핑, 블러, 밝기 조정, 색상 보정 등)
→ 확장자 변경 등
# from wordcloud import WordCloud
: wordcloud(워드 클라우드, 일명 단어구름)은 메타 데이터에서 얻어진 태그들을 분석하여 중요도나 인기도 등을 고려하여 시각적으로 늘어놓아서 표시한 것이다. 시각적인 강조를 위해서 각 태그들은 해당 중요도에 따라 글자의 색상이나 굵기 등의 형태를 변하게 할 수 있다.
→ 생성된 WordCloud를 파일로 생성하지 않고 화면에 출력하고 싶다면, matplotlib.pyplot 을 활용하면 된다.
# from collections import Counter
: collections 모듈의 Counter 클래스는 데이터의 개수를 셀 때 매우 유용하게 사용될 수 있는 라이브러리이다. Counter 생성자는 여러 형태의 데이터를 인자를 받는다. 아래 예시를 통해서 간단히 익혀보자.
1) 중복된 데이터가 저장된 배열을 인자로 (각 원소가 몇 번씩 포함되는지 객체로 출력됨)
→ Counter(["hi", "hey", "hi", "hi", "hello", "hey"])
>> Counter({'hi' : 3, 'hey' : 2, 'hello' : 1})
2) 문자열을 인자로 (각 문자가 문자열에서 몇 번씩 포함되었는지 출력됨)
→ Counter("hello world")
>> Counter({'h' : 1, 'e' : 1, 'l' : 3, 'o' : 2, ' ' : 1, 'w' : 1, 'r' : 1, 'd' : 1})
3) 가장 많이 나오거나 적게 나온 데이터 찾기
: Counter 클래스는 데이터의 개수가 많은 순으로 정렬된 배열을 return하는 'most_common()' 메서드 제공
→ Counter('hello world').most_common()
>> [('l', 3), ('o', 2), ('h', 1), ('e', 1), (' ', 1), ('w', 1), ('r', 1), ('d', 1)]
→ Counter('hello world').most_common(1) # 가장 개수가 많은 k개의 데이터 추출
>> [('l', 3)]
4) Counter를 사전처럼 활용하기
: Counter 클래스는 파이썬의 기본 자료구조인 dictionary를 확장하고 있다.
→ counter = Counter("hello world")
→ counter["o"], counter["l"]
>> (2, 3)
# from string import punctuation
: string.punctuation은 특수문자(!, #, $, & 등)들을 불러올 수 있고, 이를 활용해서 특수문자를 제거할 수 있다.
2. preprocess_text(text) - 데이터 전처리
문자열 text를 가공하여 return 시킨다.
- 모든 알파벳 대문자를 알파벳 소문자로 변경
- 특수문자를 삭제한다.
- 가공된 텍스트를 공백 문자를 기준으로 나누어서 리스트 형태로 반환한다.
# 데이터 전처리 실행
def preprocess_text(text):
    # 입력 받은 text를 모두 소문자로 변환
    text = text.lower()

    # @와 #을 제외한 특수문자로 이루어진 문자열 symbols 생성(punctuation)
    symbols = punctuation.replace('@', '').replace('#', '')

    # @와 #를 제외된 특수문자인지 확인
    print(symbols)

    # text에서 @와 #을 제외한 모든 특수문자를 제거한다.
    for symbol in symbols:
        text = text.replace(symbol, '')

    # 공백(띄어씍)를 기준으로 분리하기
    word = text.split()
    return word

# 조건에 맞게 함수가 잘 생성되었는지 검토
print("\n", preprocess_text("On my way! #Inauguration2017 https://t.co/hOuMbxGnpe"))

3. analyze_text(words) - 키워드별 분리
문자열을 포함한 words 리스트가 주어지고, 아래의 미션을 해결해보자
1) 각각의 원소는 모두 'keywords' 리스트에 저장하고, 단어가 @나 #로 시작한다면 첫번째 글자를 제거하여 저장한다. ex) #tweet → tweet 으로 저장
2) # 문자로 시작하는 원소는 'hashtags' 리스트에, @ 문자로 시작하는 원소는 'mentions' 리스트에 각각 첫번재 문자(#, @)를 제거하고 저장한다.
→ 함수는 keywords, hashtags, mentions를 반환해야한다.
→ 반환 결과에서 1~3번째 리스트는 각각 모든 키워드, 해쉬태그 키워드, 멘션 키워드를 가지고 있어야 한다.
# 모든 키워드, 해쉬태그, 멘션을 각각 추출한다.
def analyze_text(words):
    # 키워드, 해시태그, 멘션을 저장할 리스트를 각각 생성
    keywords, hashtags, mentions = [], [], []

    for word in words:

        # 해시태그일 경우
        if word.startswith('#'):
            # 해시(#)를 제외한 단어를 plain_word 변수에 저장. 맨 앞자리만 제거
            plain_word = word[1:]

            # plain_word를 조건에 맞는 리스트에 추가
            keywords.append(plain_word)
            hashtags.append(plain_word)

        # 멘션일 경우
        if word.startswith('@'):
            # @ 기호를 제외한 단어를 plain_word 변수에 저장
            plain_word = word[1:]

            # plain_word를 조건에 맞는 리스트에 추가
            keywords.append(plain_word)
            mentions.append(plain_word)

        # 그 외의 경우
        else:
            keywords.append(word)

    return keywords, hashtags, mentions

# 생성한 함수 테스트
print(analyze_text(['on', 'my', 'way', '#inauguration2017', 'httpstcohoumbxgnpe']))

4. filter_by_month(tweet_data, month) - 월별로 분리
트위터 데이터와 작성된 월(정수)을 입력 받아서 해당 월에 게시된 트위터 내용을 리스트에 저장한 후 반환
# 작성한 월을 입력받아서 해당 월에 게시한 내용 반환
def filter_by_month(tweet_data, month):
    # month를 문자열로 바꾼 month_string을 선언
    # 이 때, 한 자리 수는 앞에 '0'을 넣어준다. (ex, 1 → 01)
    month_string = '0' + str(month) if month < 10 else str(month)

    # 선택한 달의 내용을 filtered_tweets에 저장
    filtered_tweets = []
    for date, tweet in tweet_data:
        # 날짜가 선택한 달에 속해 있으면, 해당 내용을 filtered_tweets에 추가
        if date.startswith(month_string):
            filtered_tweets.append(tweet)

    return filtered_tweets

# 함수 테스트
print(filter_by_month(tweet_data = [('01-19-2017 20:13:57', 'On my way! #Inauguration2017 https://t.co/hOuMbxGnpe'),
    ('02-01-2017 00:31:08', 'Getting ready to deliver a VERY IMPORTANT DECISION!  8:00 P.M.'),
    ('03-03-2017 02:27:29', '...intentional. This whole narrative is a way of saving face for Democrats losing an election that everyone thought they were supposed.....'),
    ('03-03-2017 02:35:33', '...to win. The Democrats are overplaying their hand. They lost the election and now they have lost their grip on reality. The real story...')],
    month = 3))

위의 실행 결과를 보면, 입력한 3월에 대해서 해당 달에 입력한 내용이 정확히 출력된 것을 확인할 수 있다.
5. 트위터 통계와 그래프 출력(WordCloud)
1) 트위터 통계 출력
트위터 통계를 통해 트럼프 대통령이 트위터를 통해 가장 많이 사용한 키워드, 해시태그, 멘션을 출력해보자.
→ 위에서 전처리(특수문자가 제거된)한 함수(preprocess_text)를 통해 자료를 불러오고, analyze_text() 함수를 사용하여 앞에 기호(해시태그, 멘션)을 제거해서 counting 해보자
# 트위터 통계 출력
def show_stats():
keyword_counter = Counter()
hashtag_counter = Counter()
mention_counter = Counter()
for _, tweet in trump_tweets:
keyword, hashtag, mention = analyze_text(preprocess_text(tweet))
keyword_counter += Counter(keyword)
hashtag_counter += Counter(hashtag)
mention_counter += Counter(mention)
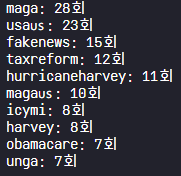
# 가장 많이 등장한 키워드, 해시태그, 멘션 출력
top_ten = hashtag_counter.most_common(10)
for hashtag, freq in topten:
print('{}: {}회'.format(hashtag, freq))
# 함수 실행
show_stats()

위의 결과처럼 hashtag(#)로 많이 등장하는 상위 10개가 잘 출력된 것을 확인할 수 있다.
가장 많이 등장한 'maga'의 의미는,
"Make America Great Again"의 약자로 전 미국 대통령인 도널드 트럼프의 대선구호이다.
2) 월별 사용한 트위터의 양을 보여주는 막대그래프 출력
1년을 기준으로, 월별로 트럼프 대통령이 트위터를 얼마나 했는지를 그래프로 시각화해보자
→ filter_by_month() 를 통해서 월별로 분리하며, 막대그래프로 출력해보자
# 월별 등록한 트위터의 갯수를 보여주는 막대그래프 출력
def show_tweets_by_month():
    months = range(1, 13)
    num_tweets = [len(filter_by_month(trump_tweets, month)) for month in months]

    plt.bar(months, num_tweets, aligh='center')
    plt.xticks(months, months)

    plt.savefig('graph.png')

# 함수 실행
show_tweets_by_month()
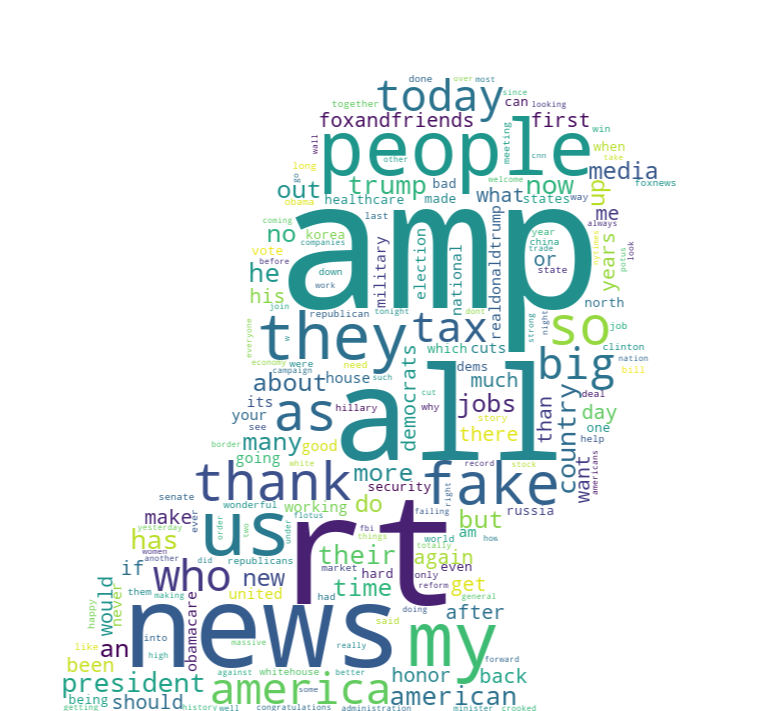
3) 가장 많이 사용된 키워드 시각화 - 단어구름(wordcloud)
wordcloud 패키지를 이용해서 트럼프 대통령 실루엣 모양의 단어구름(wordcloud)를 생성하고 시각화해보자.
→ 'trump_tweets'에서 트럼프 대통령의 트윗을 가져오고
→ 사전에 생성한 preprocess_text(전처리)와 analye_text()를 통해서 키워드별로 분류
→ 마지막으로 Counter()를 통해서 갯수를 세고, wordcloud를 생성하면 된다.
# 가장 많이 사용한 키워드에 대한 wordcloud 생성
def create_word_cloud():

    counter = Counter()
    for _, tweet in trump_tweets:
        keywords, _, _ = analyze_text(preprocess_text(tweet))
        counter += Counter(keywords)

    trump_mask = np.array(Image.open('trump.png'))
    cloud = WordCloud(background_color='white', mask=trump_mask)
    cloud.fit_words(counter)
    cloud.to_file('cloud.png')

# 함수 실행
create_word_cloud()
위의 결과처럼 WordCloud 그래프의 특성상 중요도(=빈도수)에 따라서 시각적으로 많이 부각되는 자료를 확인할 수 있다. 실제로 'in, and, to, the, of, is, for' 등의 단어들이 많이 등장했다는 것을 확인할 수 있지만, 이는 특별한 의미가 없는 단어로 판단할 수 있어 이들을 제외시키고 유의미한 단어를 추출할 수 있도록 해보자!
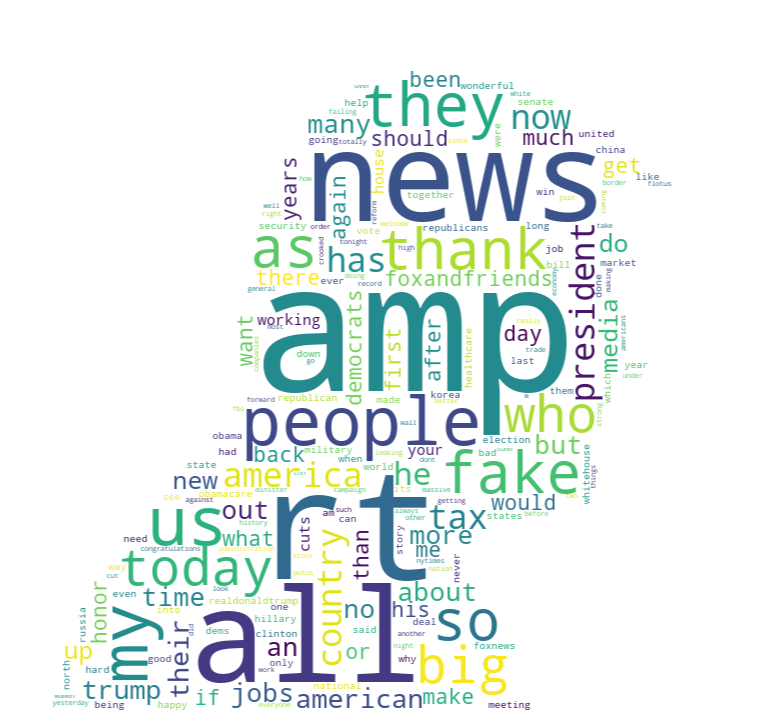
6. 오류사항 수정 (의미없는 단어 제거)
바로 위에서 실행된 것처럼 특별한 의미없는 단어로 판단될 수 있는 것을 제외시키고, 유의미한 키워드들만으로 시각화될 수 있도록 수정해보자
→ 해시태그와 키워드를 추출하는 용도로 생성했던 'analyze_text()' 함수의 일부분 수정!
→ 수정하고 다시 시각화해서 결과를 확인하자.
# 해시태그와 키워드를 추출
def analyze_text(words):
    # 키워드, 해시태그, 멘션을 저장할 리스트를 각각 생성
    keywords, hashtags, mentions = [], [], []

    # ---------------이 부분을 추가------------------------------
    # 걸러낼 단어를 자유롭게 추가 or 삭제
    filter_words = ['the', 'to', 'of', 'in', 'for', 'and', 'from', 'is', 'on', 'it', 'this',
        'that', 'are', 'was', 'will', 'with', 'very', 'a', 'be', 'by', 'must', 'just', 'not',
        'you', 'great', 'we', 'our', 'have', 'at', 'i']

    # 쪼갠 단어들을 분류합니다.
    for word in words:

        # 위에서 정의한 filter_words 를 이용해 의미없는 단어는 제거할 수 있다.
        if word in filter_words:
            continue
    # ----------------여기까지 추가 ------------------------------

        # 해시태그일 경우
        if word.startswith('#'):
            # 해시(#)를 제외한 단어를 plain_word 변수에 저장
            plain_word = word[1:]

            # plain_word를 적절한 리스트에 추가합니다.
            keywords.append(plain_word)
            hashtags.append(plain_word)

        # 멘션일 경우
        elif word.startswith('@'):
            # @ 기호를 제외한 단어를 plain_word 변수에 저장
            plain_word = word[1:]

            # plain_word를 적절한 리스트에 추가
            keywords.append(plain_word)
            mentions.append(plain_word)

        # 둘 다 아닐 경우
        else:
            # word를 적절한 리스트에 추가
            keywords.append(word)

    return keywords, hashtags, mentions
- filter_words : 무의미한 단어를 임의로 설정하여 필터링시킬 리스트
- if word in filter_words:
continue
→ 입력받을 'word'가 필터링리스트(filter_words)에 포함되는 경우, continue되어 어떠한 리스트에도 분류가 되기 않게 되므로 필터링리스트에 추가한 단어들은 자동적으로 제외시킬 수 있게 된다.
위의 결과를 보면 첫번재로 시각화했던 그래프와 달리 무의미한 단어(ex, 관사)와 같이 필터링리스트(filter_words)에 추가한 요소들은 그래프로 시각화되지 않은 것을 확인할 수 있다.
7. 최종 코드
최종 코드를 정리하고 main 함수를 통해서 출력할 결과를 다르게 할 수 있다.
→ main(1) : 가장 많이 등장한 키워드, 해시태그, 멘션 출력
→ main(2) : 트럼프 대통령의 월별 트윗 개수를 막대그래프로 출력
→ main(3) : 트럼프 대통령의 트윗 키워드로 wordcloud(단어구름) 시각화
 # 트럼프 대통령의 트윗 모음을 불러오기
from tweets import trump_tweets

# 그래프에 필요한 라이브러리를 불러오기
import matplotlib.pyplot as plt

# 단어구름에 필요한 라이브러리를 불러오기
import numpy as np
from PIL import Image
from wordcloud import WordCloud

# 특화된 컨테이너 모듈에서 수 세기를 돕는 메소드를 불러오기
from collections import Counter

# 문자열 모듈에서 특수문자를 처리를 돕는 메소드를 불러오기
from string import punctuation


# 1) 데이터 전처리를 실행
def preprocess_text(text):
    # 분석을 위해 text를 모두 소문자로 변환
    text = text.lower()

    # @와 #을 제외한 특수문자로 이루어진 문자열 symbols 생성
    symbols = punctuation.replace('@', '').replace('#', '')

    # text에서 @와 #을 제외한 모든 특수문자를 제거
    for symbol in symbols:
        text = text.replace(symbol, '')

    # text를 띄어쓰기 단위로 분리
    words = text.split()
    return words


# 2) 해시태그와 키워드를 추출
def analyze_text(words):
    # 키워드, 해시태그, 멘션을 저장할 리스트를 각각 생성
    keywords, hashtags, mentions = [], [], []

    # 필터링할 단어를 자유롭게 추가 or 삭제
    filter_words = ['the', 'to', 'of', 'in', 'for', 'and', 'from', 'is', 'on', 'it',
    'this', 'that', 'are', 'was', 'will', 'with', 'very', 'a', 'be', 'by', 'must',
    'just', 'not', 'you', 'great', 'we', 'our', 'have', 'at', 'i']

    # 쪼갠 단어들을 분류
    for word in words:

        # filter_words 를 이용해 의미없는 단어는 제거할 수 있다.
        if word in filter_words :
            continue

        # 해시태그일 경우
        if word.startswith('#'):
            # 해시(#)를 제외한 단어를 plain_word 변수에 저장
            plain_word = word[1:]

            # plain_word를 적절한 리스트에 추가
            keywords.append(plain_word)
            hashtags.append(plain_word)

        # 멘션일 경우
        elif word.startswith('@'):
            # @ 기호를 제외한 단어를 plain_word 변수에 저장
            plain_word = word[1:]

            # plain_word를 적절한 리스트에 추가
            keywords.append(plain_word)
            mentions.append(plain_word)

        # 둘 다 아닐 경우
        else:
            # word를 적절한 리스트에 추가
            keywords.append(word)

    return keywords, hashtags, mentions

# 3) 월별로 분리하기
def filter_by_month(tweet_data, month):
    # month를 문자열로 바꾼 month_string을 선언
    # 이 때 한 자리 수는 앞에 '0'을 넣어준다. (ex: 1 => '01')
    month_string = '0' + str(month) if month < 10 else str(month)

    # 선택한 달의 트윗을 filtered_tweets에 저장
    filtered_tweets = []
    for date, tweet in tweet_data:
        # 트윗의 날짜가 선택한 달에 속해 있으면 트윗의 내용을 filtered_tweets에 추가
        if date.startswith(month_string):
            filtered_tweets.append(tweet)

    return filtered_tweets


# 4) 트윗 통계를 출력
def show_stats():
    keyword_counter = Counter()
    hashtag_counter = Counter()
    mention_counter = Counter()

    for _, tweet in trump_tweets:
        keyward, hashtag, mention = analyze_text(preprocess_text(tweet))
        keyword_counter += Counter(keyward)
        hashtag_counter += Counter(hashtag)
        mention_counter += Counter(mention)

    # 가장 많이 등장한 키워드, 해시태그, 멘션을 출력
    top_ten = hashtag_counter.most_common(10)
    for hashtag, freq in top_ten:
        print('{}: {}회'.format(hashtag, freq))

# 5) 월 별 트윗 개수를 보여주는 그래프를 출력
def show_tweets_by_month():
    months = range(1, 13)
    num_tweets = [len(filter_by_month(trump_tweets, month)) for month in months]

    plt.bar(months, num_tweets, align='center')
    plt.xticks(months, months)
    plt.savefig('graph.png')

# 6) wordcloud 패키지를 이용해 트럼프 대통령 실루엣 모양의 단어구름을 생성
def create_word_cloud():

    counter = Counter()
    for _, tweet in trump_tweets:
        keywords, _, _ = analyze_text(preprocess_text(tweet))
        counter += Counter(keywords)

    trump_mask = np.array(Image.open('trump.png'))
    cloud = WordCloud(background_color='white', mask=trump_mask)
    cloud.fit_words(counter)
    cloud.to_file('cloud.png')

# 7) 입력값에 따라 출력할 결과를 선택
def main(code=1):
    # 가장 많이 등장한 키워드, 해시태그, 멘션을 출력
    if code == 1:
        show_stats()

    # 트럼프 대통령의 월별 트윗 개수 그래프를 출력
    if code == 2:
        show_tweets_by_month()

    # 트럼프 대통령의 트윗 키워드로 단어구름을 그리기
    if code == 3:
        create_word_cloud()


# 8) main 함수를 실행
if __name__ == '__main__':
    main(3)

'Data Analyst > Project & Practice' 카테고리의 다른 글
| 넷플릭스 영화 추천 알고리즘 파이썬 코드로 구현하기! 시청데이터로 예상 선호도 산출! (2) | 2023.12.04 |
|---|---|
| JSON 형식을 dictionary로 변환할때 알아야 할 이론과 실습! (w/넷플릭스 시청데이터) (1) | 2023.12.04 |
| [파이썬 데이터분석] 가장 많이 사용하는 '영어 단어'는? 코드 구현! (2) | 2023.11.20 |
| 데이터 분석 - 파일/데이터의 구조/그래프 다루기 기초 정리! (1) | 2023.11.18 |
| [파이썬] 데이터 분석하기 위해 꼭 알아야 할 기초 7가지!! (이론+실습) (0) | 2023.11.14 |


댓글